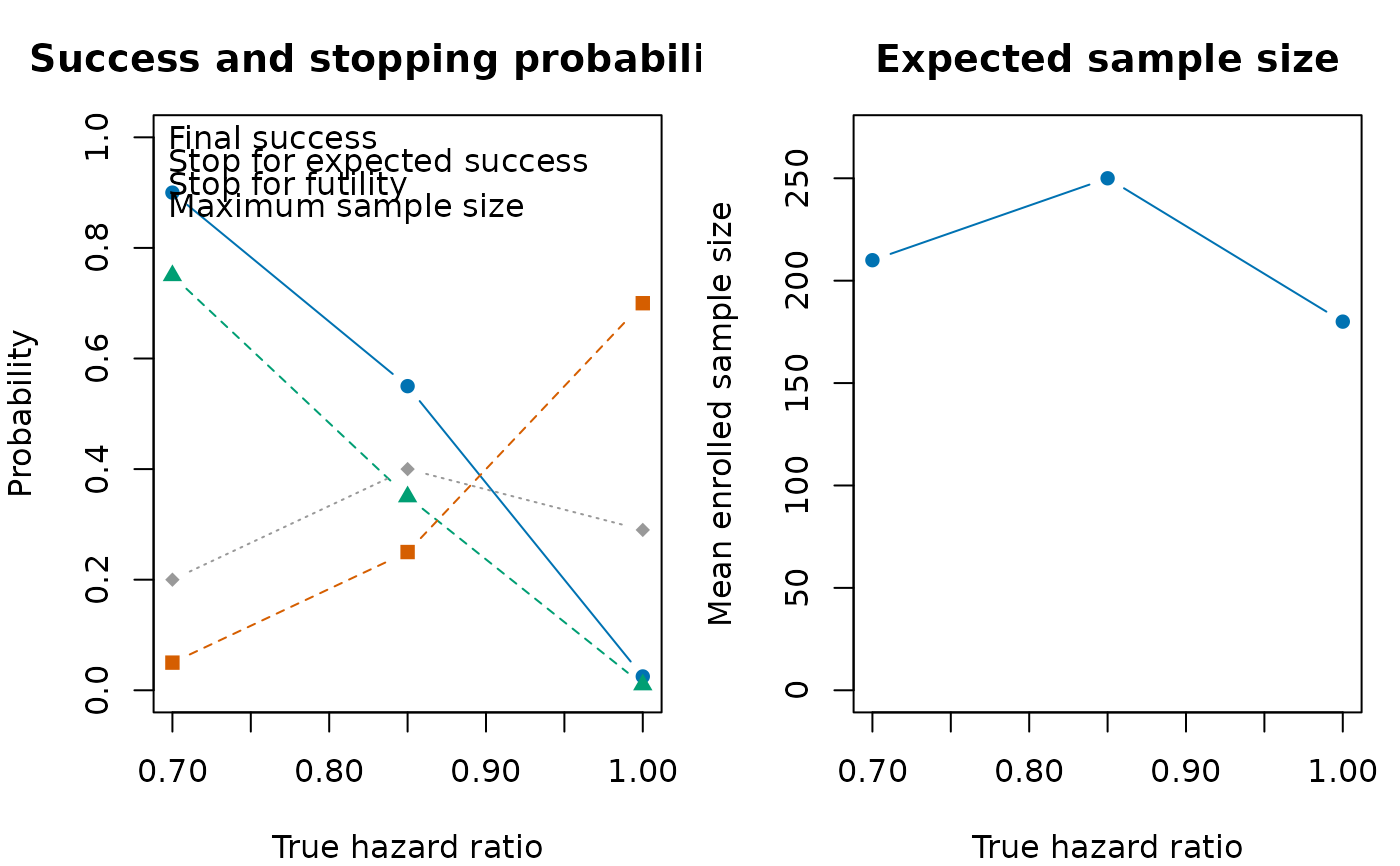
Draws operating-characteristic curves across a series of true treatment-effect scenarios. The first panel shows final success and stopping probabilities. The second panel shows mean enrolled sample size.
Arguments
- x
A required data frame returned by
summarise_sims(), with one row per simulation scenario and columnspower,stop_success,stop_futility,stop_max_N, andmean_N. When present,stop_immediate_successis plotted separately fromstop_success, which retains its historical expected-success meaning.- effect
A required numeric vector containing one finite treatment-effect value per row of
x, or a single character string naming such a numeric column inx.- xlab
A single character string for the treatment-effect axis label. The default is
"True treatment effect".
Examples
operating_characteristics <- data.frame(
  scenario = c("null", "small", "target"),
  effect = c(1, 0.85, 0.7),
  power = c(0.025, 0.55, 0.9),
  stop_success = c(0.01, 0.35, 0.75),
  stop_futility = c(0.7, 0.25, 0.05),
  stop_max_N = c(0.29, 0.4, 0.2),
  mean_N = c(180, 250, 210),
  sd_N = c(45, 60, 55),
  stop_and_fail = c(0.001, 0.01, 0.02)
)
plot_sim_ocs(
  operating_characteristics,
  effect = "effect",
  xlab = "True hazard ratio"
)