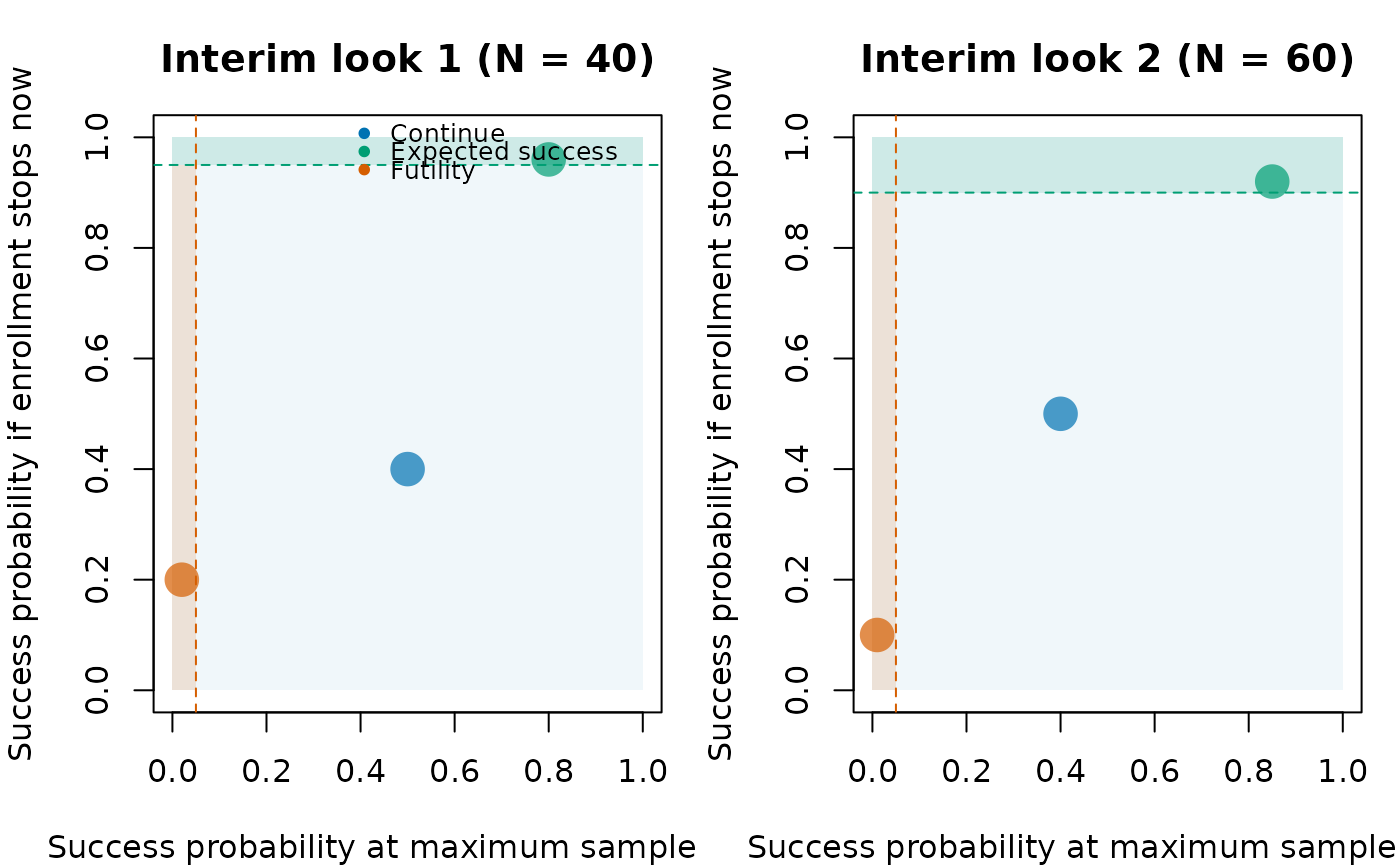
Draws one decision map per interim look across simulated trials. The horizontal axis is the predictive probability of success if enrollment continues to the maximum sample size, and the vertical axis is the predictive probability of success if enrollment stops at the current sample size. Shaded regions and dashed lines show the futility, continuation, stopping-accrual-for-expected-success, and immediate-success rules. Identical points are aggregated; point size indicates their frequency.
Arguments
- x
A required result returned by
sim_trials()withreturn_trace = TRUE, or the correspondingtracesdata frame. The trace must contain interim-look numbers, predictive probabilities, decision thresholds, and decisions.
Details
The upper shaded region represents
ppp_stop_now > immediate_success_threshold; the middle region represents
success_threshold < ppp_stop_now <= immediate_success_threshold. Futility
applies below or at the expected-success threshold when the
maximum-sample-size prediction is strictly below its threshold. A legacy
trace without immediate_success_threshold is treated as if that threshold
were one, which disables immediate success.
Examples
traces <- data.frame(
  trial = 1:6,
  look = rep(c(1, 2), each = 3),
  planned_N = rep(c(40, 60), each = 3),
  ppp_stop_now = c(0.96, 0.4, 0.2, 0.92, 0.5, 0.1),
  success_threshold = rep(c(0.95, 0.9), each = 3),
  immediate_success_threshold = 0.99,
  ppp_success_at_max = c(0.8, 0.5, 0.02, 0.85, 0.4, 0.01),
  futility_threshold = 0.05,
  decision = c(
    "stop_expected_success", "continue", "stop_futility",
    "stop_expected_success", "continue", "stop_futility"
  )
)
plot_sim_decisions(traces)